Selecting and understanding the different graph metrics
There are several different metrics to choose from to be displayed on the graph and they are located on the left side of the page under "Metrics."
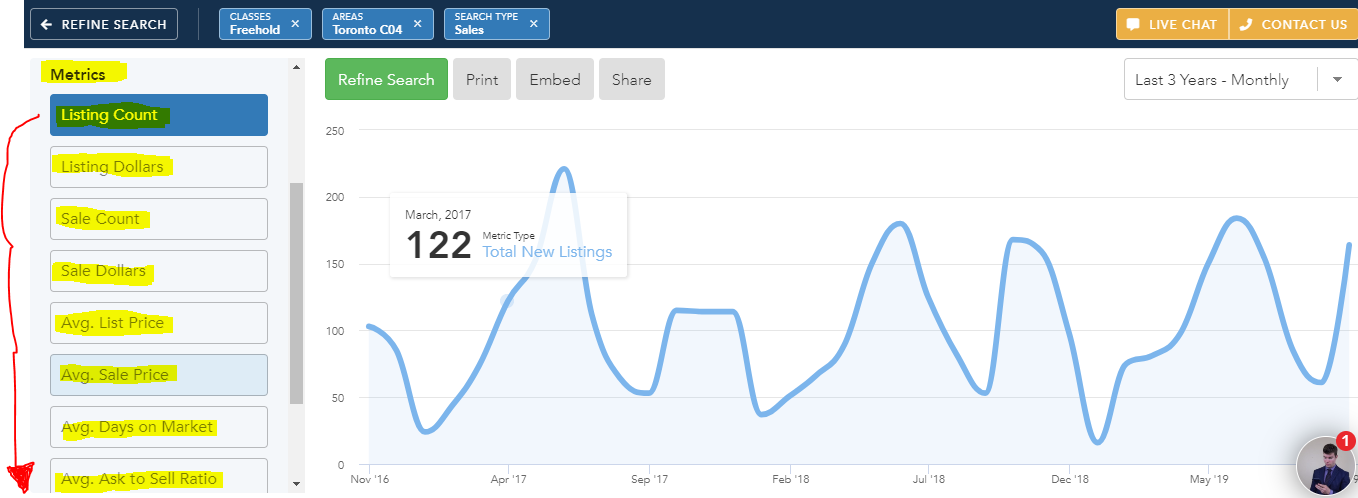
You could select from one of the following:
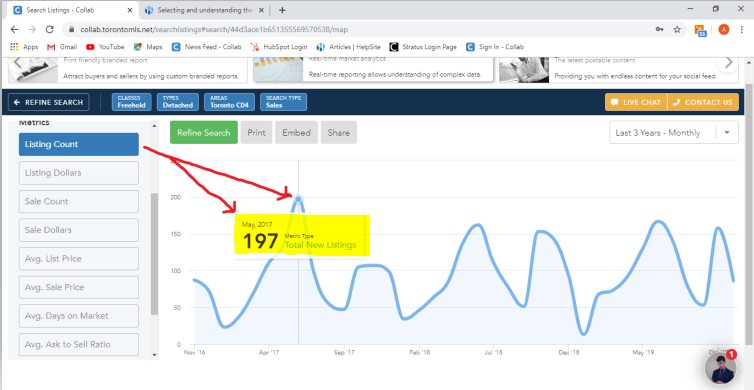
- Listing Count: Displays the total new listings for each point on the graph
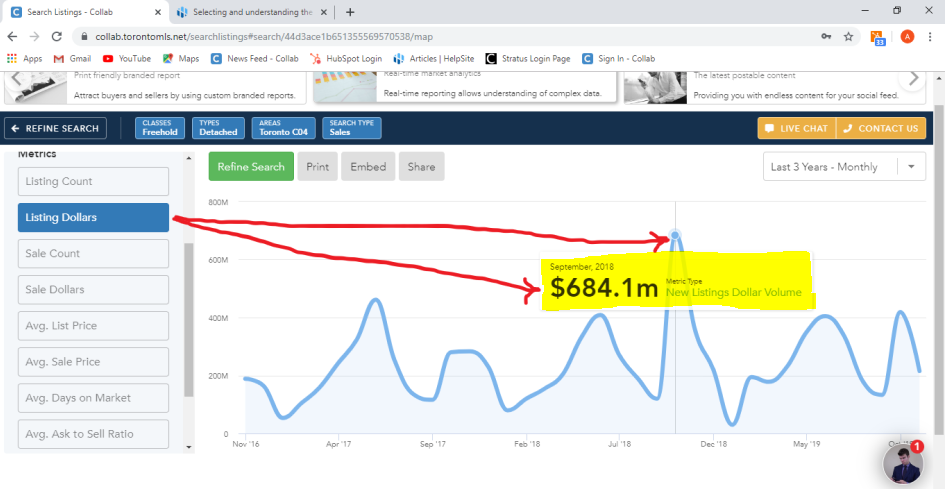
- Listing Dollars: Displays the new listings dollar volume for each point on the graph
- Sale Count: Displays the sales count for each point on the graph
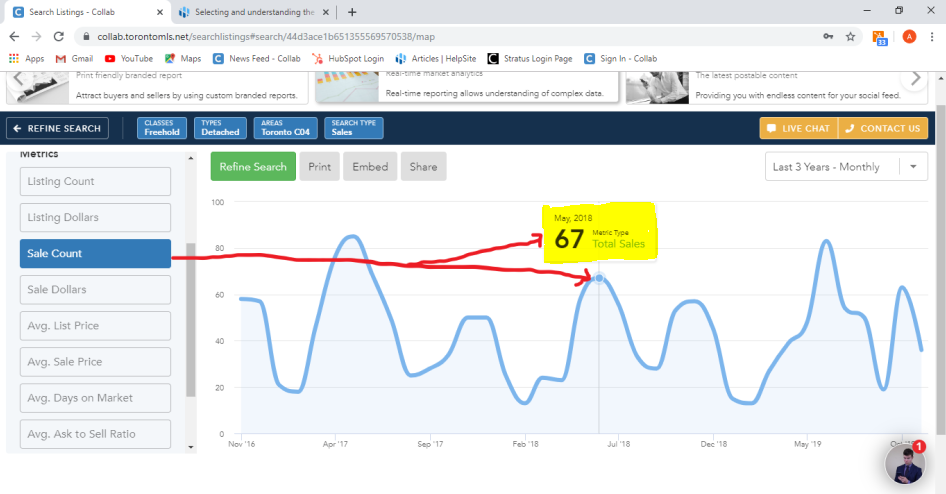
- Sale Dollars: Displays the total sales volume for each point on the graph
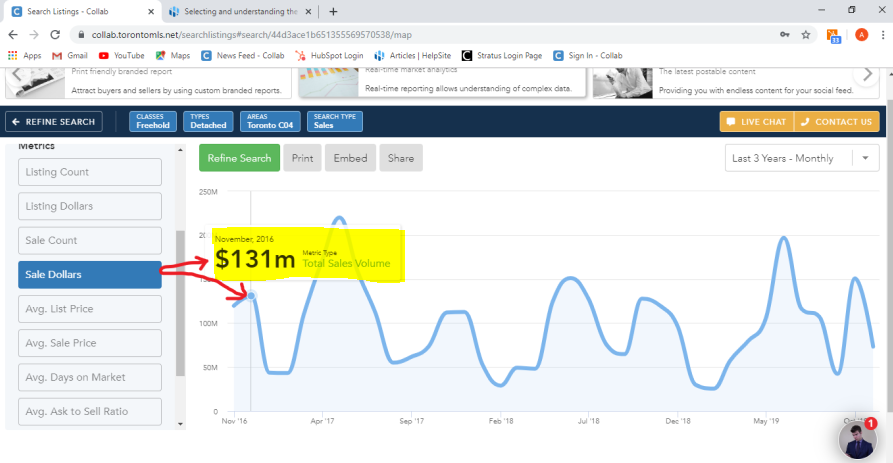
- Avg. List Price: Displays the average list price for each point on the graph
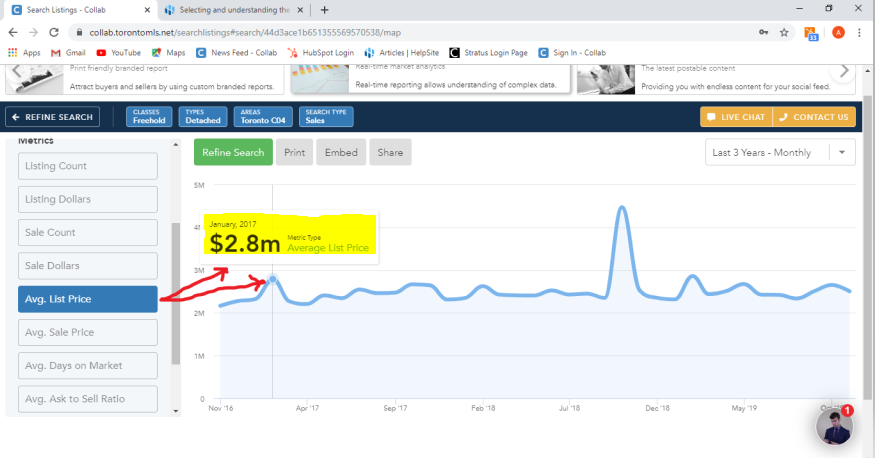
- Avg. Sale Price: Displays the sales average price for each point on the graph. To get the average sale price, take the total sales volume and divide it by the total number of sales for date selected.
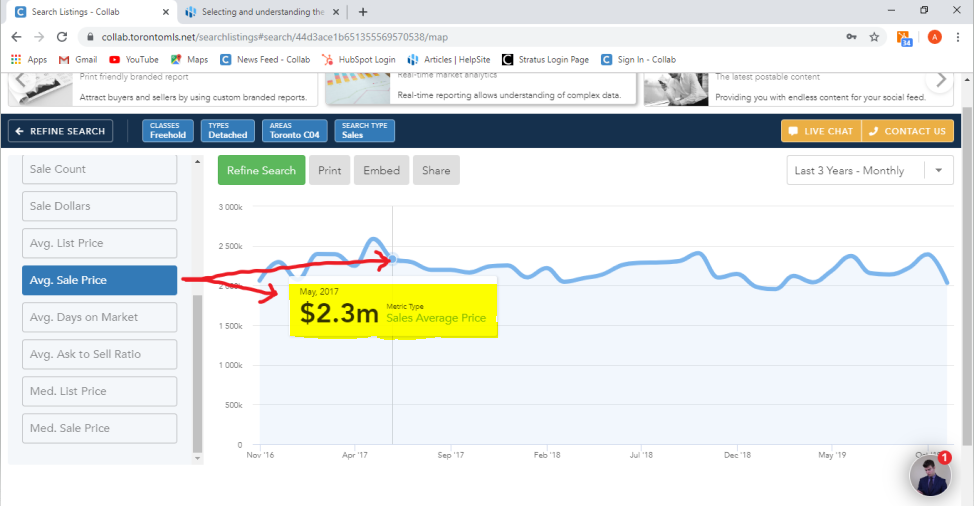
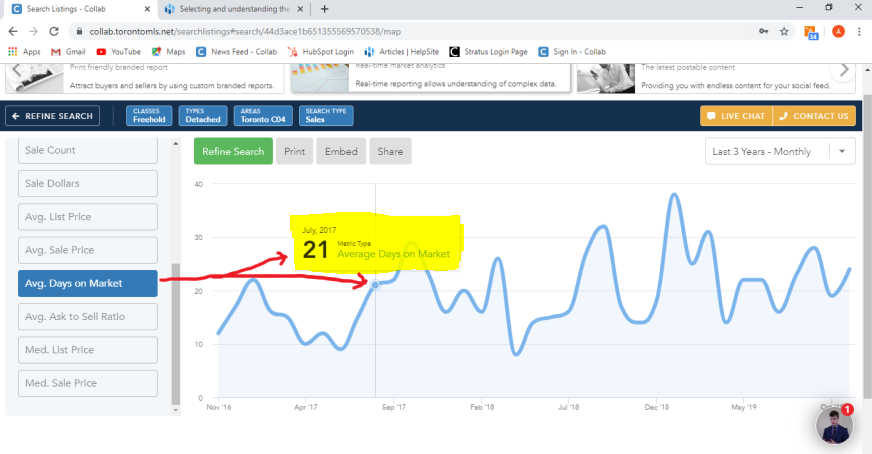
- Avg. Days on Market: Displays the average days on market for each point on the graph
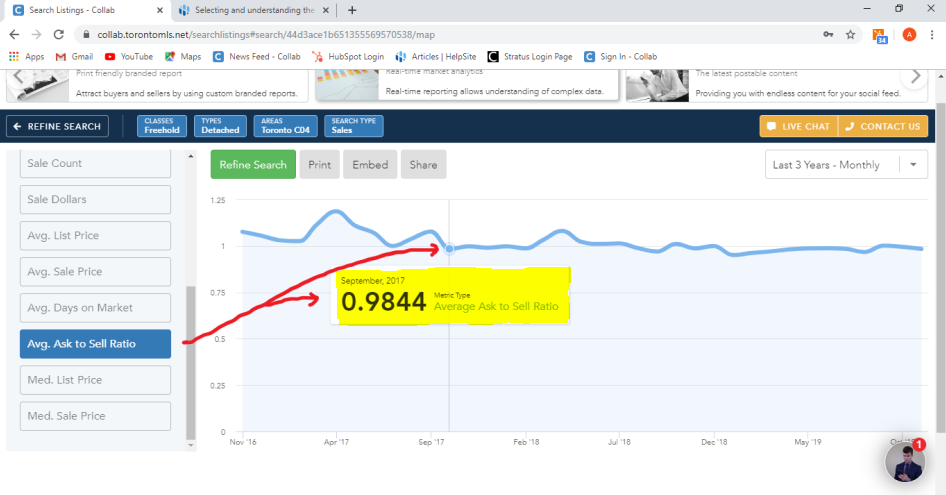
- Avg. Ask to Sell Ratio: Displays the average ask to sell ratio for each point on the graph. This compares the asking price of listings to the sell price of listings based on sold listings as of date selected.
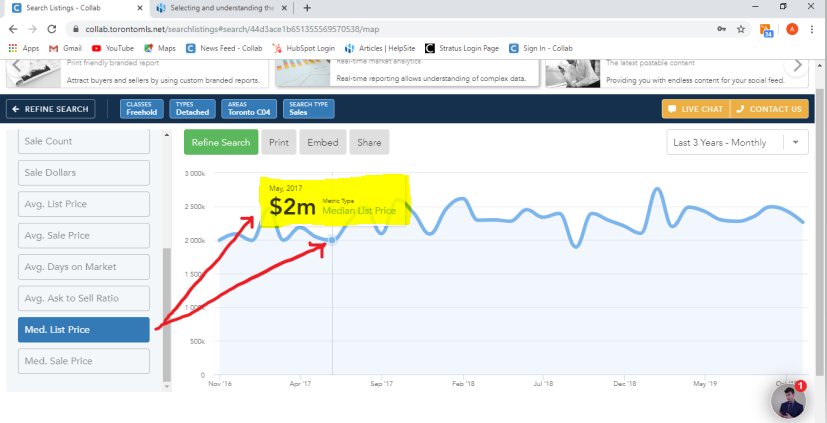
- Med. List Price: Displays the median list price for each point on the graph
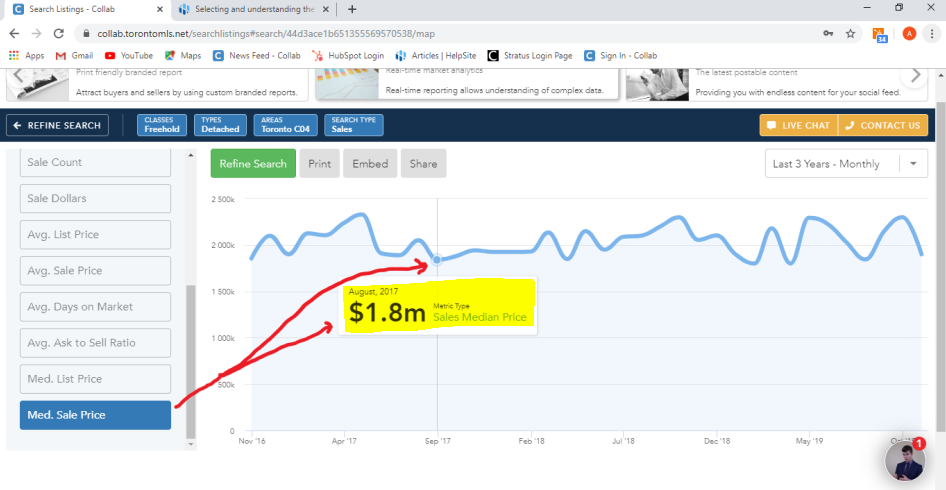
- Med. Sale Price: Displays the sales median price for each point on the graph
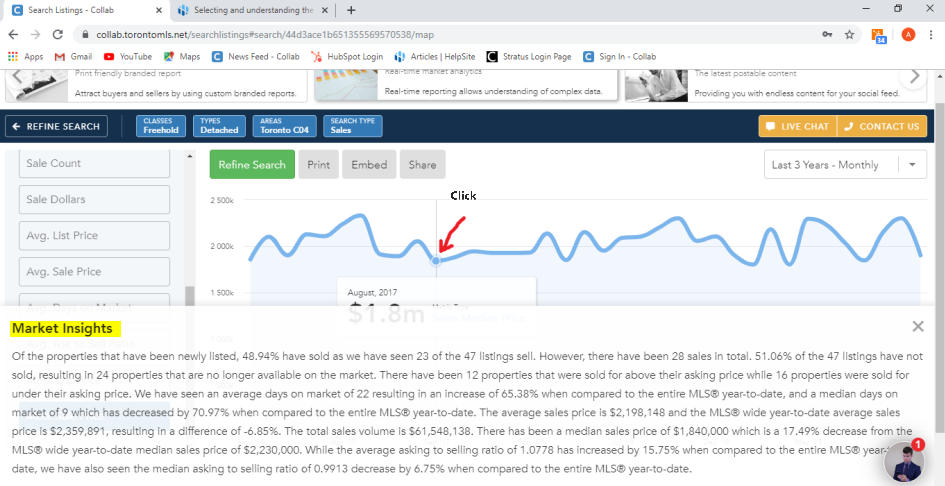
Clicking on any of the points will bring you to "Market Insights" which is a narrative for the date selected: